
8.4% overall
profit improvement
Reduced products
from 5 to 2
The Challenge
A coal mine in New South Wales, Australia wanted to investigate the financial impact of modifications in export product definitions as well as the financial impact of export product consolidation.
The Technical Marketing team wanted to understand if existing thermal export product definitions are well aligned with the coal mine's distribution of coal energy, ash, and washability, given their current negotiated mining schedule as well as value chain constraints and various contractual commitments.
Technical Marketing wished to also investigate whether a smaller consolidated product set could replace the existing product set while achieving a financially similar outcome for the mine.
Production consolidation was a significant area of interest, as it was expected to confer many practical benefits associated with operational and business process simplification.
The Solution
The aim of this project was to undertake an accurate technical marketing study whose purpose was to align marketing and operational planning. The study was conducted as a three day time-boxed exercise to demonstrate how BlendOpt Integrated Planning Software can be used to rapidly explore a specific question and build a business case for improving alignment between market conditions and value chain operations.
Experiments focused on adjustments to the quality specifications of export thermal coal products. The chosen set of product adjustments were motivated by an initial analysis that investigated the distribution of optimised product volumes and associated product definitions (see Methods).
A BlendOpt integrated planning model was developed for this client including several model constraints found to be essential to the accurate alignment of marketing and operational planning.
The integrated planning model included client mine scheduling data and costs, ROM stockpile blending and constraints, crushing and CHPP processing rates and availability, coal washability data, post-CHPP stockyard blending models, conveyor and railing constraints, committed sales contracts, product quality acceptance ranges, product pricing forecasts, and quality-based price adjustment factors. A simplified illustration of the value chain is shown in Figure 1.

This integrated planning model was designed to support a range of strategic as well as operational business decisions as well as planning processes for the client, meaning that some model features were noncritical to the findings of this particular study.
Study Results
A number of experiments were conducted whereby one or more existing products were replaced with new products having a modified quality acceptance specification and associated modifications in pricing forecast (see Study Methodology). A presentation of all results is outside the scope of this report and only selected results are reported in this section.
Among the product replacement experiments, the most noteworthy are the single product and two product replacement experiments reported in Table 1. For experiment EXP-7 (Single Product Replacement), product 5950 was replaced with a new product 6100. The new product specification requires a small 150 kcal/kg (2.7%) increase in minimum CV. Running BlendOpt on this new problem definition resulted in an optimised product strategy with an 8.4% increase in total profit over eight months. Experiment EXP-7 displayed the most pronounced profit uplift, however other single product replacement experiments also exhibited opportunities for improvement. For experiment EXP-3 (Two Product Replacement), product 5950 was replaced with a new product 6100 and product 6200 was replaced with new product 6300 resulting in an 11.4% increase in total profit over eight months.
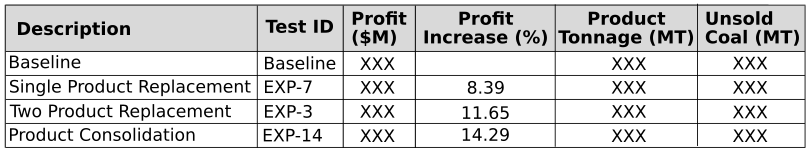
In our view, the most noteworthy finding from this study is shown in experiment EXP-14 where two new products replace all five existing export products (Product Consolidation). This result displays a considerable profit increase of 14%, yet also presents a remarkably simplified marketing strategy.
Results analysis suggests that the origins of the observed profit improvement are likely derived from a better alignment between product definitions and the Ash-CV-Yield relationship of mined coal.
Improvements to market strategy discovered within these experiments typically corresponded with modest increases in the total volume of unsold coal . If model constraints forced the sale of all ROM coal, this impacted the findings of this study, particularly for experiments that alter the existence of low energy product definitions. This conclusion is not surprising within the context of this study, as current market conditions were generally known to be unfavourable for certain plies.
Additional experiments (not shown) indicated that quantitative results and conclusions are sensitive to cost modelling assumptions, particularly as costs approach parity with revenue for select product definitions. This is an expected outcome, however it highlights the importance of accurate financial modelling, particularly under tight market conditions.
The key insights that were summarised within this study are unexpected and potentially could have considerable impact to the client. Prior to communicating these results to a wider stakeholder audience, the client used independent 3rd party consultancy to validate these findings. In addition, the client used their BlendOpt software license to extend this study to include:
- Inclusion of a more comprehensive cost model to validate robustness of reported results to different cost assumptions.
- Evaluation of result sensitivity to alternative price forecast scenarios.
- Experiment replication on additional mine schedules using relevant marketing planning time horizons.
Study Methodology
New product modelling
As shown in Figure 2, pricing discounts for Newcastle indexed thermal products (e.g. 5950, 6250, 6200, 6350) exhibit a strict linear relationship with product CV acceptance ranges. It is therefore expected that any interpolated thermal export product will similarly adhere to the linear function specified within Figure 2.

Other quality attribute ranges (Moisture, VM, S) were derived in this study by linear interpolation of the two current products most similar in energy. This "locally linear" assumption is a close approximation to quality targets that would be negotiated by a marketing team (analysis not shown). Moreover, small deviations from these assumptions are expected to have a trivial impact on the final results due to the fact these quality attributes are rarely active constraints within customer's optimal marketing plans (results not shown).
Definition of new products
Experiments that were restricted to the existing product definitions displayed optimised results with consistently high volumes of product 5950 and consistently low volumes of minimum energy (5700) and maximum energy (6350) products. An indicative example is shown in Figure 3.

Given the high volumes of product 5950 and low volumes of 5700, we anticipated that product strategy improvements were unlikely to involve new products with CV lower than 5950's specifications. Thus, most tests in this study involved new product definitions with CV ranges between the 5950 and 6350 products, namely the new 5800 and 6300 products shown in Table 2.

To reduce the number of new products to consider in this study, we used an equidistance interpolation to define any new products (see Figure 2), which greatly reduces the number of new products that can be defined. In particular, new product 6100 is an exact equidistance specification between products 5950 and 6250, while new product 6300 is equidistant to products 6250 and 6350. In addition, some tests also involved new product 5800 which was created by extrapolation of products 5950 and 6250.
Test Coverage
Given the time-boxed nature of this study, a systematic Design-Of-Experiments approach to test coverage was not conducted. Instead, the test coverage shown in Table 3 was generated using an exploratory procedure whereby each new test condition was motivated by the findings of previous tests. Note that only selected results from the tests below are presented within this report.

Hypotheses
Hypothesis 1: The current set of thermal export product definitions is optimally aligned with the mine site's distribution of coal energy, ash, washability, and associated mining schedule. Evidence that potentially contradicts this hypothesis is found in the distribution of product volumes (Figure 3) as well as additional results analysis (not shown).
Hypothesis 2: A smaller product set cannot replace the existing product set while achieving a financially competitive result for the client. Evidence that potentially contradicts this hypothesis is found in the distribution of product volumes (Figure 3) as well as the linear relationship between price and CV (Figure 2).
The Value Unlocked for our Client
The integrated planning model used within this study accounted for detailed operational and business constraints that enabled a high degree of financial estimation accuracy within a technical marketing study. Considerations included published coal mining schedules, dynamic CHPP and supply chain modelling, coal washability data, sales contracts, product quality targets and acceptance ranges, price forecasts, and quality-based price adjustment factors. The following noteworthy observations resulted from this study:
- A 2.7% increase to CV in the highest volume thermal product corresponded with a 8.4% overall profit improvement for the coal mine.
- Two new product definitions were able to replace all five existing export products with a remarkable eight-month profit improvement of 14.3%.
The product consolidation results are particularly noteworthy given the trade-offs that are typically expected between reductions in the number of unique products and theoretical profitability afforded from product diversity.
Unlock efficiency with BlendOpt—discover how to optimise your planning and scheduling
Do you optimize product placement into the market?
Do you know when Demurrage adds value (can you spot “value justified” demurrage)?
Do you know in what situations your stockpile quality models increase contract rejection risk?
Does your planning software require stable operations, predictable markets, consistent orebodies?
Can you run scenarios to understand your options?
Does your tactical scheduling software automatically synchronize with your longer term planning tools?
Do your schedules reflect conditions on the ground?
Are your schedules tossed in the bin on day 1?